Now that we’ve identified our daily CO2 footprint: How to display it?
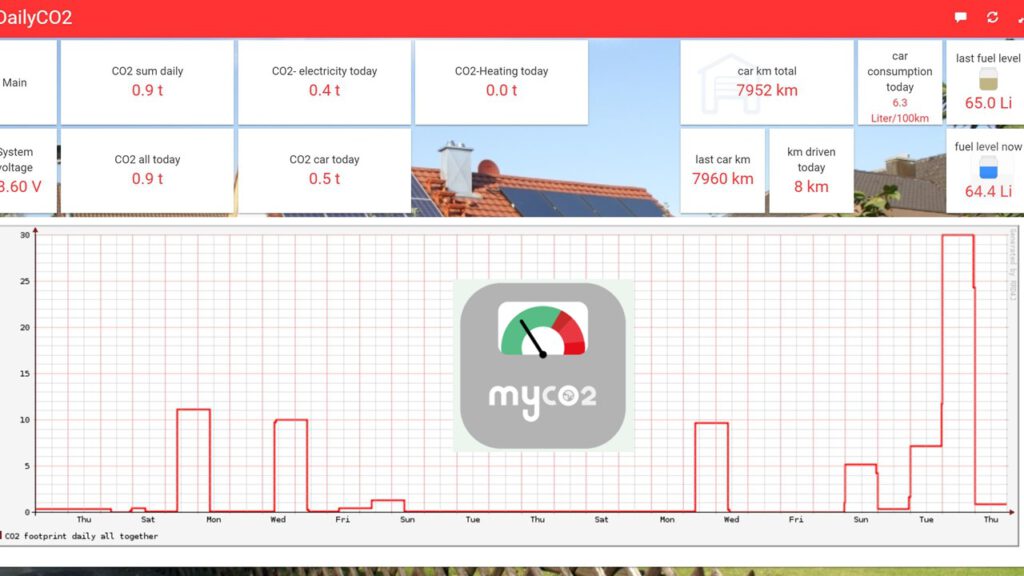
#1: directly with OpenHab – called HabPanel
A web page with graphics is a standard function in OpenHab. it is called HabPanel
If you use OpenHab2 already, it doesn’t need any programming. Just click and select the variables (=items in OpenHab2) that you like to display. Tons of manuals exist, a nice one in German language can be found here
Hints for newcomers:
Openhab displays graphics only, if you add the item to the configuration file: „rr4dj.persist“ like
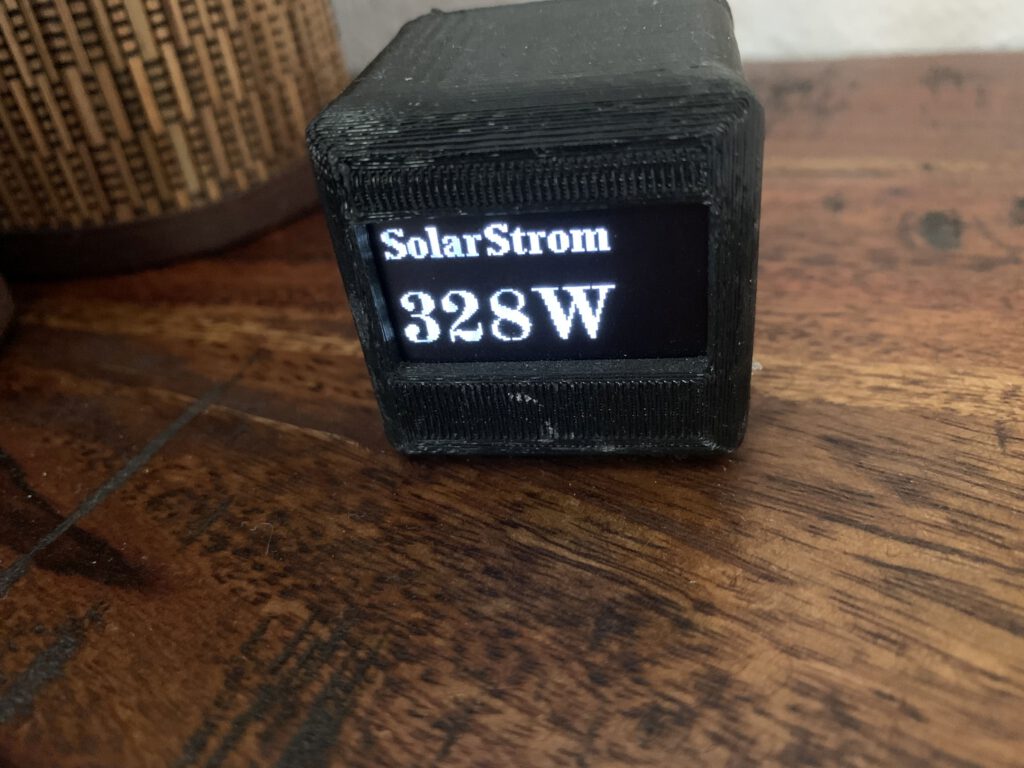
#2: Have a nice little display in your living room – reminding you permanently
find the ESP software as well as the OpenHab config files in Github It simply alternates each value once per minute that I found useful, such as: today’s CO2 footprint in annual tons, current power consumption etc. Housing is 3D printed. Pick a nice one from Thingiverse. I used this one
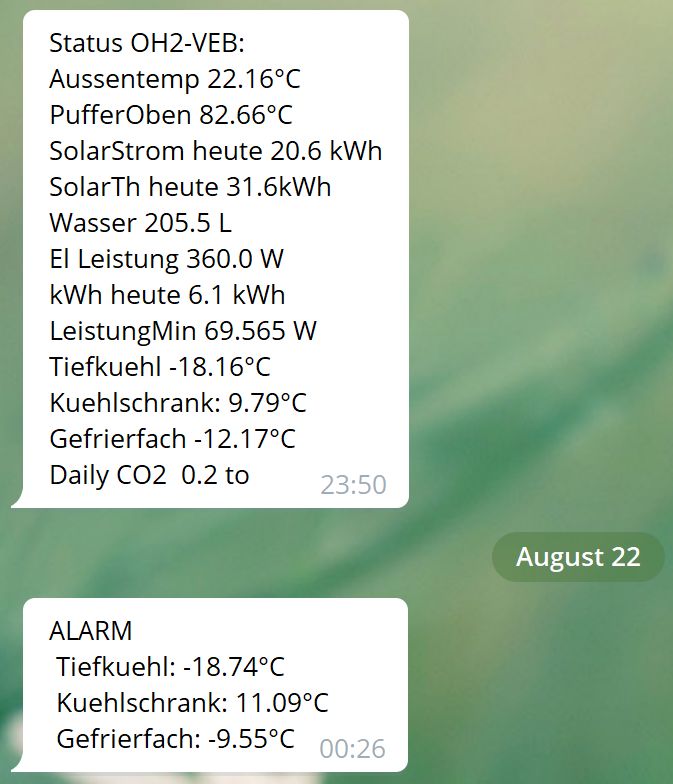
#3: get a daily report via Telegram
if so many people are sending you messages each day, why not getting one from your house once a day – not only for CO2, but also to see if your fridge is ok whilst you are on vacation. I found the OpenHAB2 documentation useful. Lots of examples, but: Don’t worry, setting up the bot one time only, and then using one single example from „Send a text message with a formatted message“ is sufficient